
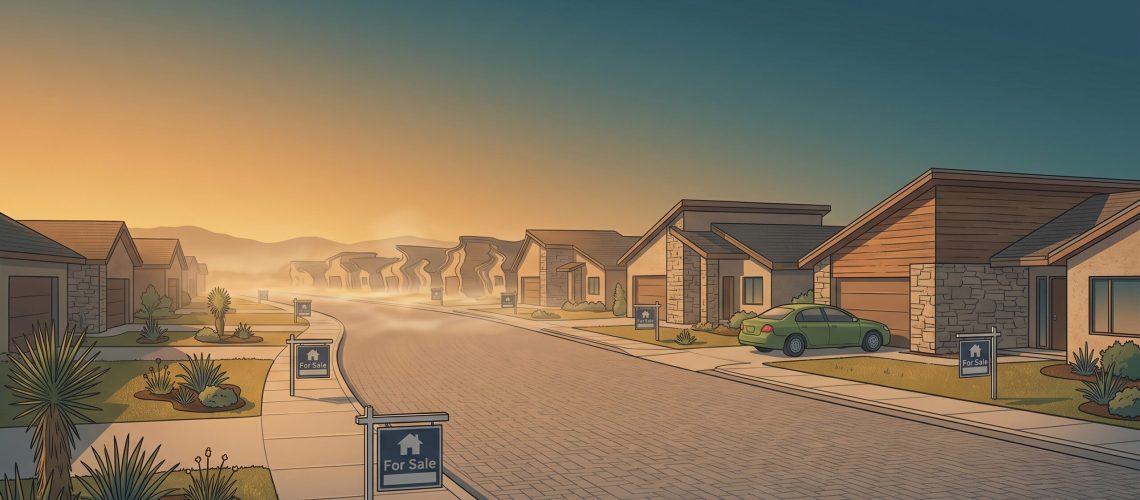

Great Valley's Price Reductions Are a Mirage
Quick Answer: 46.7% of active listings in Great Valley have been reduced — the highest rate of any district covered this season. It looks like widespread seller panic. It's actually concentrated in one Toll Brothers development, Anfield at Malvern, where 61% of 18 active homesites are already price-reduced as part of a standard, phased release strategy. Pull that development out, and Great Valley's resale market has a healthy 27-day median days on market — faster than the district-wide headline suggests.
If you searched Great Valley real estate this week, the headline reduction rate would look like a market in real trouble. It isn't — the real story is one builder's production pipeline, not broad buyer pullback. We traced the full picture in a recent discussion. Listen or read the full transcript here.
One Development, Nearly a Fifth of the District's Supply
Great Valley has roughly 91 active listings. Of those, 27 are new construction — about 30% of all active inventory — and 18 of those 27 belong to a single development: Toll Brothers' Anfield at Malvern, spread across Anfield Road, Alroy Road, and Kemlyn Road in Malvern, priced roughly $650,000 to $930,000. That's nearly one-fifth of the district's entire active supply concentrated in one coordinated micro-market.
Toll Brothers has released these homesites on a rolling one-to-three-week cadence all summer: May 17, June 10, July 11, July 20, August 1, three more on August 15, six more on August 22, and two more on September 5. Of the 18 currently active, 11 — 61% — already carry a price reduction. The newest releases haven't been marked down yet simply because they're too new; of the 16 released before them, 11 already have been. This is a standard, healthy production-builder strategy — phased release paired with rolling price adjustments to keep a pipeline moving — not evidence of a struggling project.
Why This Drags the Whole District's Numbers
New construction here is both slower and pricier than resale: a 41-day median days on market and $796,000 median price, versus resale's 27-day median and $749,900 median. Because it's both slower and more expensive, new construction pulls the district-wide blended average in the same direction on both counts, making the whole market look softer than the resale segment actually is.
The statistics show this distortion directly: district-wide median active days on market is 27.5, but the mean is nearly double, at 49.6 — a 22-day gap. That's the mathematical signature of a concentrated cluster of slower, pricier listings pulling the average up, similar to one very high earner skewing a room's average salary without moving the median much at all.
The same dynamic repeats at the very top of the market. Estates at Howell Ridge released three nearly identical lots — $2.47 million, $2.50 million, and $2.55 million — on the same day. All three remain active and unreduced at 108 days. Releasing near-identical inventory simultaneously removes urgency at any price point: buyers know they can compare all their options and simply wait.
Why June Underperformed Even Though It Was the Year's Best Month
Great Valley's settlement trend hit a real, raw peak on schedule: June posted 67.9% of sales at or above asking price and a 2.22% average premium, before fading through July and a negative August (-0.75% average result). But compared to Great Valley's own history, June still fell 2.97 percentage points short of its historical June average — the worst seasonal shortfall of any peak month covered this season, even though June was 2026's best month in raw terms.
The explanation traces back to the same new-construction pipeline. Traditional June highs are driven by scarcity: buyers competing hard for a limited pool of resale homes before the school year. Toll Brothers' steady drip of new inventory throughout the exact months buyers are writing contracts diluted that scarcity district-wide — buyers who lost a bidding war on a resale home didn't need to panic, because new homesites were reliably coming a few weeks later. Less panic meant fewer frenzied bidding wars, which meant June never hit the premium a typical Great Valley June delivers.
The Luxury Trend Reversed, Not Continued
Median days on market for closed $1 million-plus sales looked like a steady four-year slowdown — 30 days in 2022, climbing to 40, then 49, then peaking at 50 in 2025. Year-to-date in 2026, that figure has dropped sharply back to 31 days, nearly its 2022 level. Treat this as a genuine reversal, not a blip to dismiss or a continuation to fear — luxury sellers should plan around the faster 2026 reality rather than the slower conditions of the prior two years.
The Bottom Line
If you're selling a resale home in Great Valley, the district-wide 46.7% reduction rate doesn't describe your market — resale is moving in a healthy 27-day median. If you're weighing new construction against resale, know that new-construction pricing here has real, documented room to negotiate. And more broadly: before reacting to any alarming district-wide statistic, it's worth asking whether it reflects the whole market, or the footprint of one very active, identifiable player within it.
Listen to the Full Discussion
This post is the condensed version. The full episode walks through the complete release timeline, the full price-band breakdown, and more on how new-construction pipelines reshape buyer psychology during peak season. Listen or read the full transcript here.
For weekly market data across 41 school districts, visit our Market Intelligence Tool.
Have Questions About the Great Valley Market?
Whether you're pricing a resale home, weighing new construction against resale, or trying to understand what a headline market statistic actually means for your situation, we're happy to walk through the data with you.
We'll personally respond within a few hours. No autoresponders, no sales team — just us.
Or call (484) 259-7910